

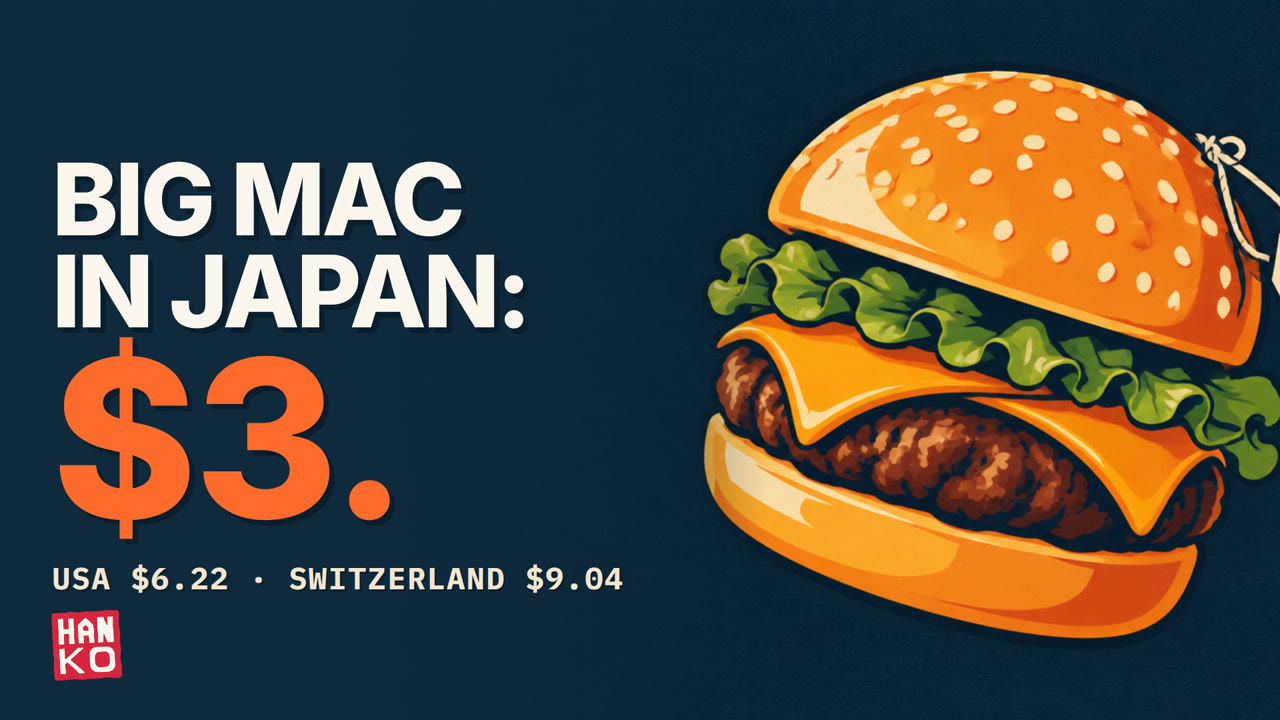
Japan is cheap for visitors because three things compounded: the yen fell to its weakest level in nearly 40 years, consumer prices barely rose for about 25 years, and pay in 2025 was still below its 1997 level. In July 2026 a Big Mac cost ¥500 in Japan, about $3.08, against $6.22 in the US. In January 2012 Japan’s was the pricier one, $4.16 to $3.81 (The Economist).
The weak yen is the easy answer, and it is true, but it is only part of the story. The other two causes explain why the yen’s fall hit so hard, and why the bargain for visitors is the mirror image of a squeeze on the people who live there.
One cause, two sides
In 2025, visitors made a record 42.7 million trips to Japan, up from 31.9 million in 2019 (JNTO). They spent about ¥9.45 trillion, also a record (Japan Tourism Agency). The government’s target is 60 million visitors a year by 2030, spending ¥15 trillion (Japan Tourism Agency).
Traffic the other way shrank. Departures by Japanese travelers fell from about 20.1 million in 2019 to about 14.7 million in 2025 (JNTO). Both figures count trips, not people. What makes Japan a bargain for visitors makes the rest of the world expensive for the Japanese.
What “cheap” really means
Economists compare what the same basket of goods and services costs in each country, a measure called purchasing power parity. On the World Bank’s 2025 figures, what cost $1 in the US cost about ¥97 in Japan, yet $1 bought about ¥150 on the currency market (World Bank). By our calculation, that puts Japan’s prices at about 65% of America’s in dollar terms (our math). Japan is not uniquely cheap: on the same measure, South Korea comes out at about 57% (World Bank; our math).
The gap shows up on the street. At ¥157.18 to the dollar (Federal Reserve), a regular beef bowl at Yoshinoya, ¥498, is about $3.17 (Yoshinoya). The shortest Tokyo Metro ride costs ¥178 with an IC card, about $1.13, while every New York subway ride is $3.00 (Tokyo Metro; MTA). A one-day ticket to Tokyo Disneyland starts at ¥8,900, about $57; Disneyland in California starts at $104 (Tokyo Disney Resort; WDWNT). Both parks use variable pricing, so these are the lowest prices as of September 2026.
Not everything is cheap. The iPhone 18 Pro costs ¥219,800 in Japan including 10% consumption tax. Before tax that is ¥199,818, about $1,271, roughly 6% more than the $1,199 US price before sales tax (Apple; Apple; our math). That is the clue. Goods priced globally cost about the same everywhere. What is cheap in Japan is what is made and priced locally, such as meals, train rides and tickets. In other words, Japanese labor.
Suspect 1: the yen
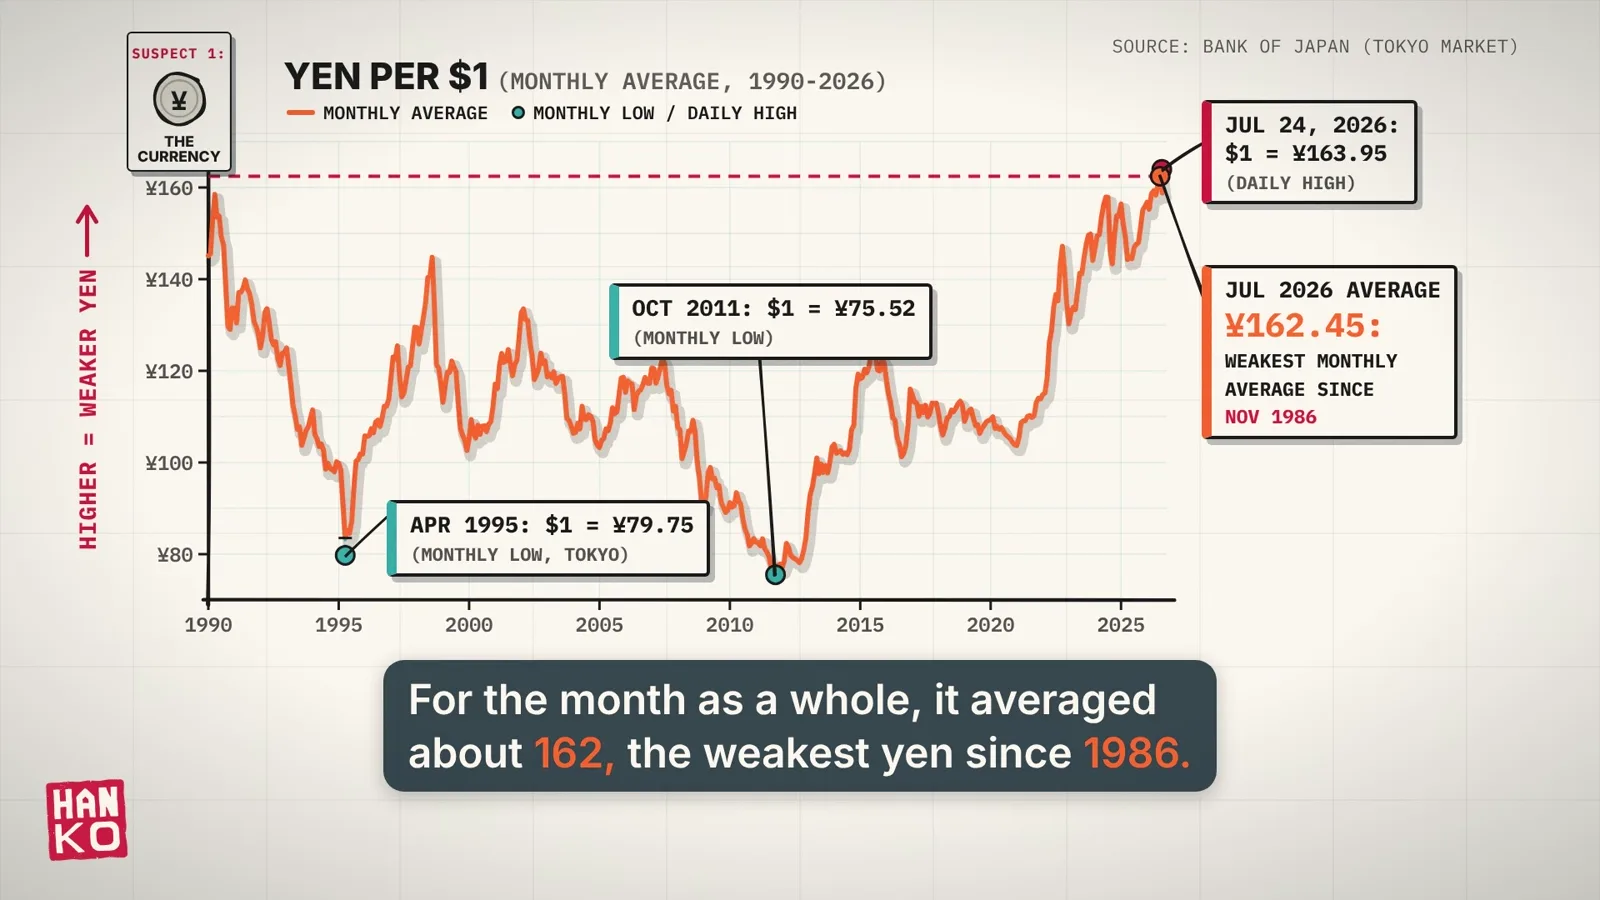
In April 1995, a dollar bought fewer than 80 yen at the monthly low in Tokyo (¥79.75); in October 2011, fewer than 76 (¥75.52). On 24 July 2026 it briefly bought ¥163.95. July’s monthly average, ¥162.45, was the yen’s weakest since November 1986 (Bank of Japan).
That is the Big Mac flip. Between January 2012 and July 2026, its price in Japan rose 56%, from ¥320 to ¥500, but its dollar price fell by about a quarter, from $4.16 to $3.08 (The Economist; our math).
Interest rates are the usual explanation. For years Japan kept its policy rate at or below zero (it was negative until March 2024) while the US raised its rates: the federal funds target was 5.25-5.50% in July 2024 (Bank of Japan; Federal Reserve). Money tends to flow toward the higher return. Rates alone cannot explain 2026, though. By September 2026 the Bank of Japan was at 1.25% and the Fed at 3.75-4.00%, so the gap had roughly halved, from about 5.3 points to about 2.6 by our calculation (our math). The yen still sank to a nearly 40-year low that July.
Suspect 2: prices that stood still
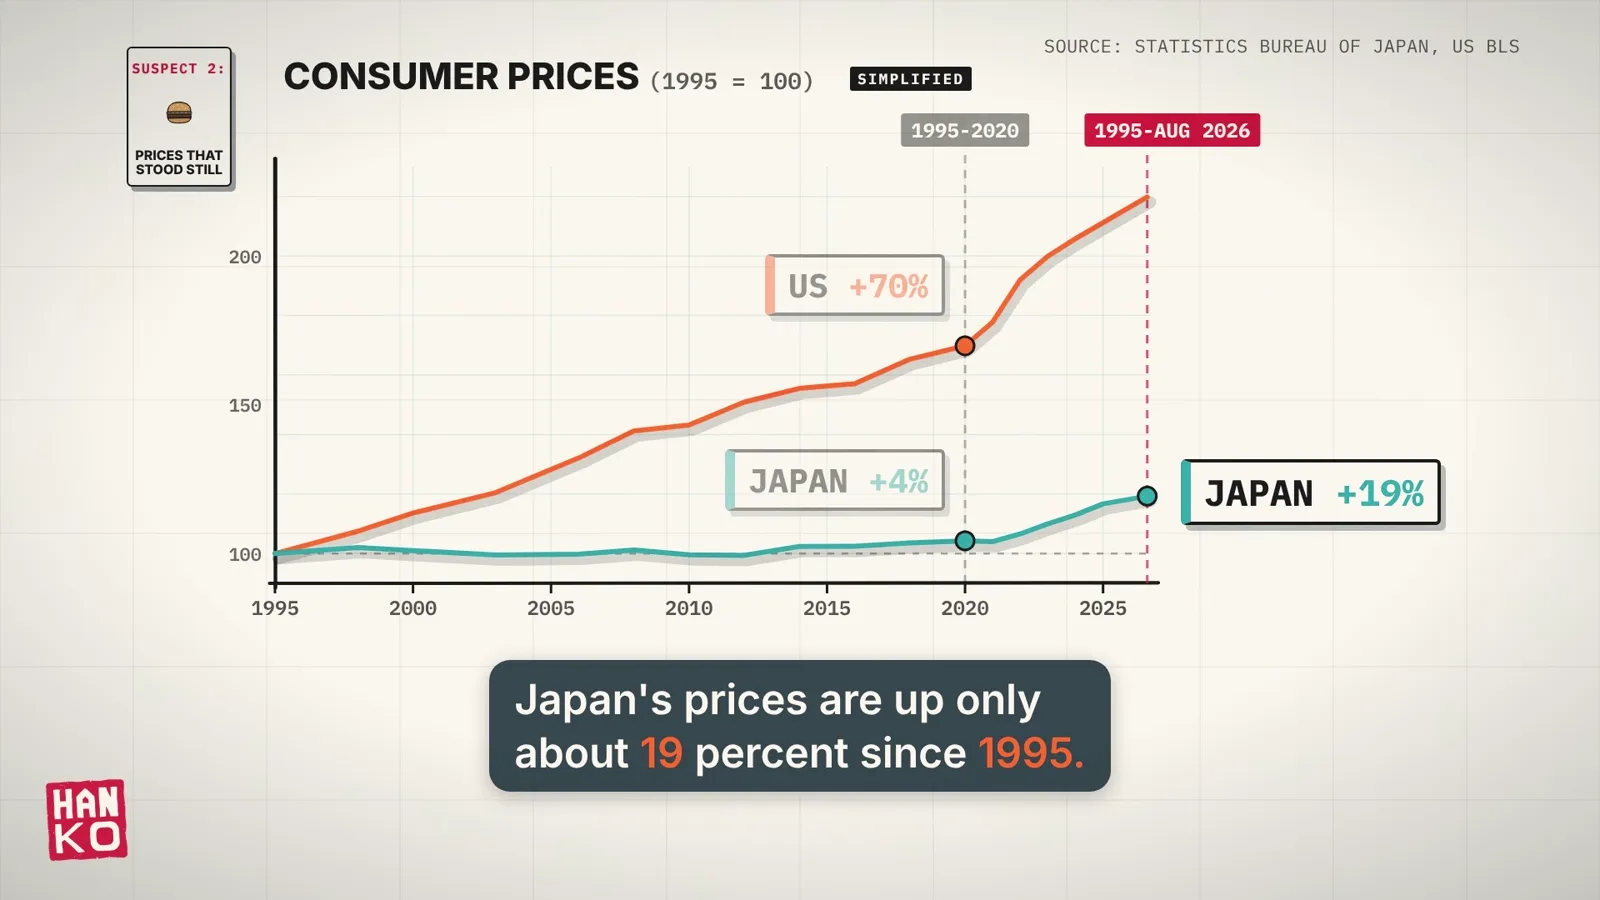
From 1995 to 2020, Japan’s consumer prices rose about 4% in total, not per year. US prices rose about 70% over the same 25 years (Statistics Bureau of Japan; US BLS). Even after the recent burst of inflation, Japan’s prices were only about 19% above their 1995 level in August 2026, while America’s had more than doubled, up about 120%.
So even if the exchange rate had never moved, Japan would have become cheaper for foreigners, just by standing still while prices elsewhere climbed.
Suspect 3: pay that froze
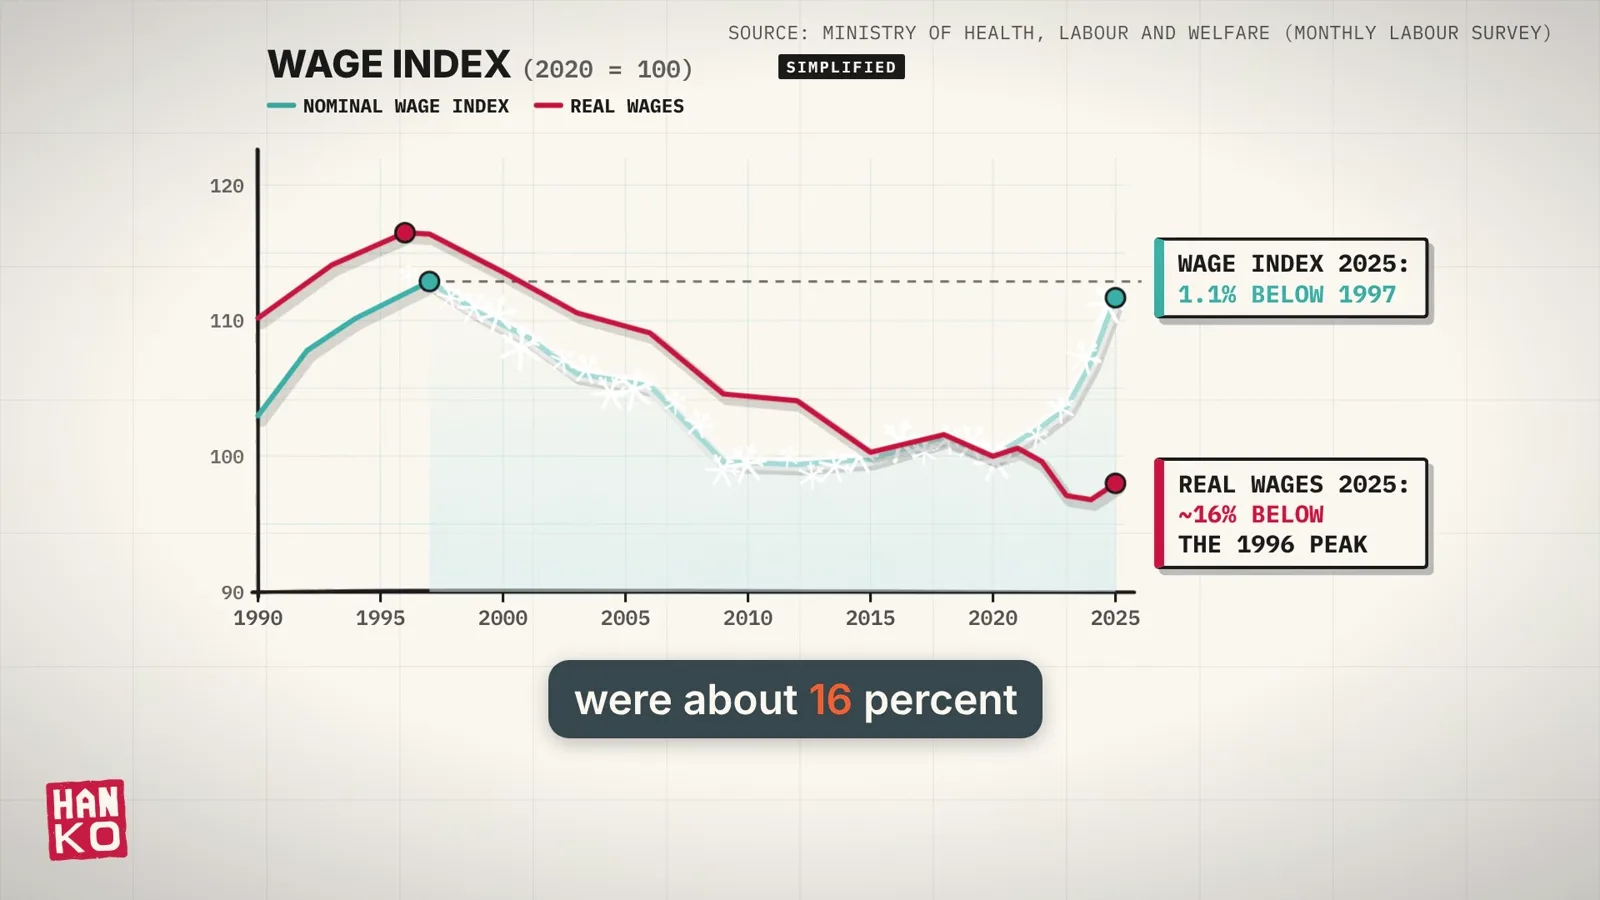
Pay ties the other two together. In 1997 the average worker in Japan earned ¥371,670 a month, including bonuses. In 2025 the figure was ¥355,941 (MHLW). Part of that drop reflects more part-time work pulling down the average. But even the official wage index, which adjusts for breaks in the survey sample, was still about 1.1% below 1997 in 2025. After inflation, real wages in 2025 were about 16% below their 1996 peak (our math).
The three suspects fed each other in a loop. When pay does not rise, people cannot pay more, so companies do not raise prices. When prices do not rise, companies do not raise pay. Why the loop began is a question for another episode. What matters here is that it held for the better part of 25 years.
How the three multiply
One measure combines the exchange rate with relative prices: the real effective exchange rate, which compares the yen with a broad basket of Japan’s trading partners after adjusting for prices. Wages enter it only indirectly, through prices. It stood at 194 in April 1995. In July 2026 it hit 65, the lowest in data going back to 1970 (Bank of Japan). By our calculation, the yen has lost about two-thirds of its buying power abroad since that 1995 peak (our math).
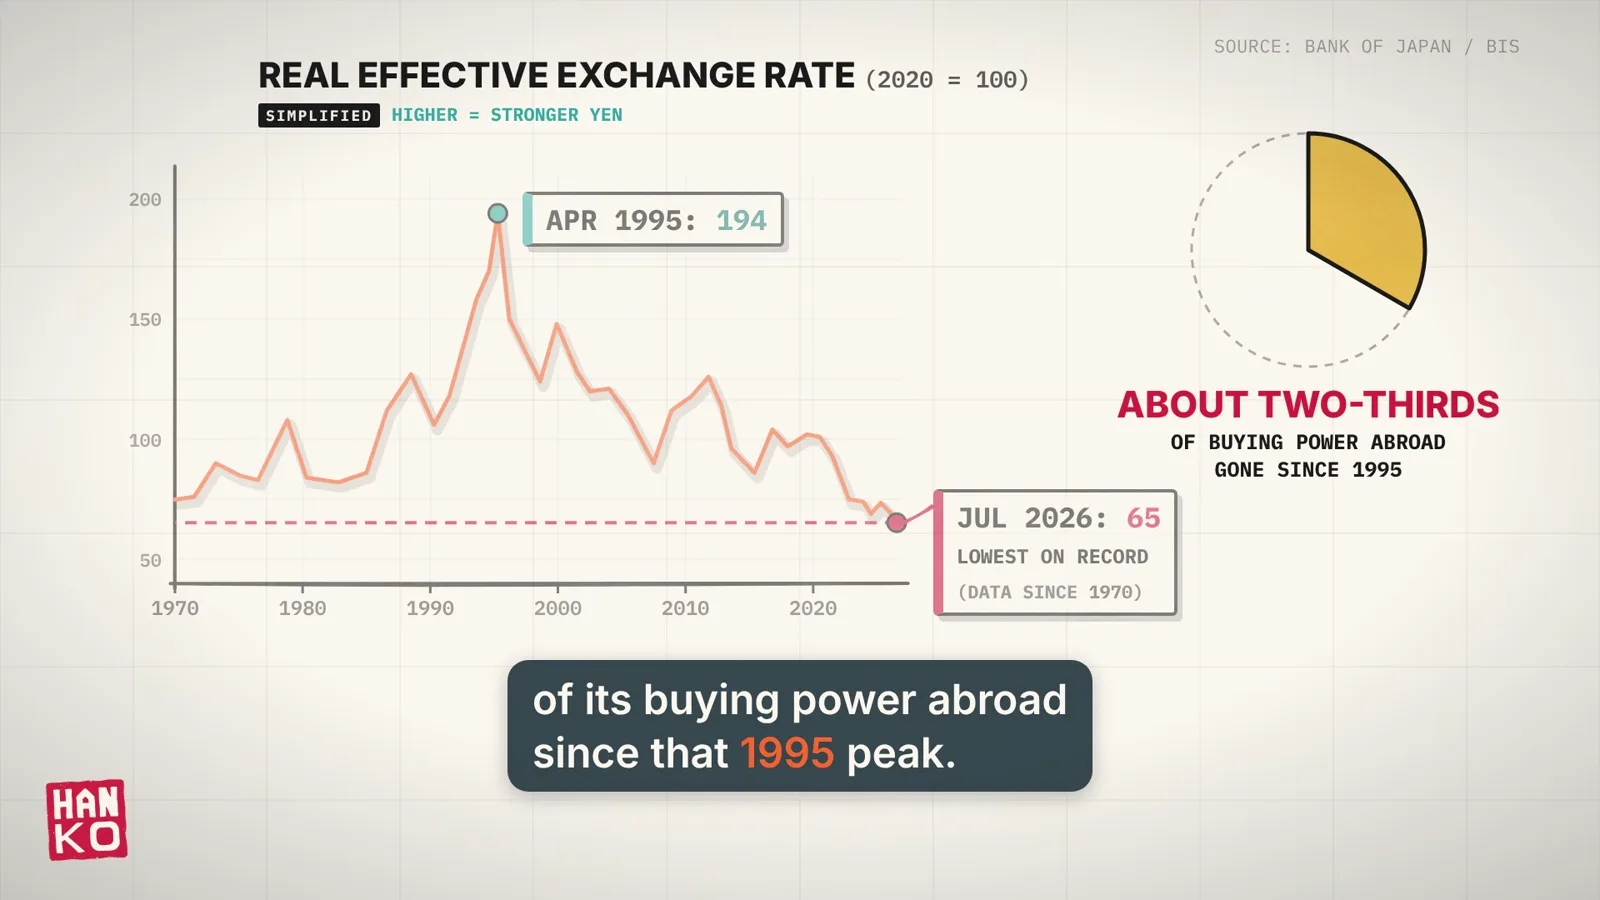
Weak currency, flat prices and flat pay add up to the World Bank comparison above: in 2025, a dollar went about 1.5 times as far in Japan as at home (World Bank; our math).
Who wins, who pays
Big exporters win, because a car sold for dollars brings home more yen. Visitors win too. But the textbook payoff of a weak currency, selling more abroad, largely did not happen. A Finance Ministry panel found that Japanese exporters largely stopped cutting their foreign prices when the yen fell, so export volumes did not rise much. Japan earned more yen per sale rather than making more sales (Ministry of Finance).
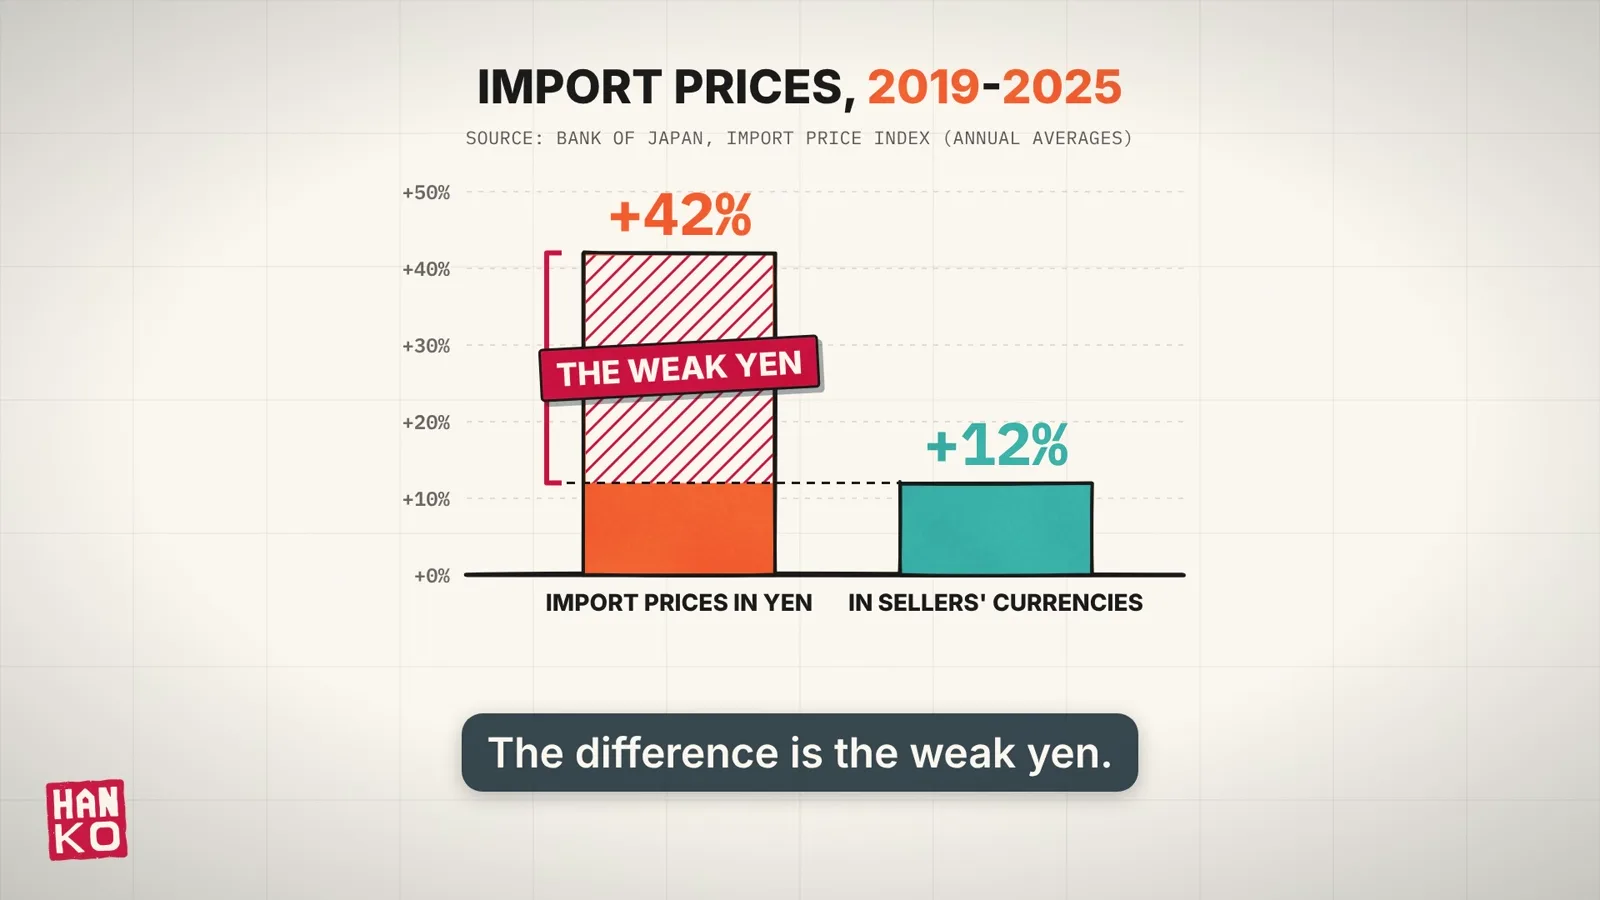
Everyone who buys from abroad pays. Measured in yen, Japan’s import prices rose about 42% from 2019 to 2025. Measured in the sellers’ own currencies, they rose about 12% (Bank of Japan). The difference is the weak yen.
Food in Japanese shops cost about 26% more in 2025 than in 2021 (Statistics Bureau of Japan). Not all of that is the yen: non-Koshihikari rice rose 67% in 2025 alone, a domestic supply story (Statistics Bureau of Japan). The Bank of Japan’s July 2026 outlook puts the trade-off plainly: a weaker yen lifts the profits of global firms but pushes down households’ real income and squeezes smaller firms, mainly through import prices (Bank of Japan).
For Japanese travelers the world got expensive. At ¥157.18 to the dollar, the $6.22 American Big Mac costs about ¥978, nearly twice the ¥500 price at home (The Economist; our math). JTB estimated that a summer 2026 trip abroad would cost about ¥323,000 per person, nearly seven times the ¥48,500 of a domestic trip (JTB). At the end of 2025 Japan had 22.8 million valid passports, which by our calculation is fewer than one in five Japanese nationals (MOFA; Statistics Bureau of Japan; our math).
Why does the yen not bounce back? Japan still earns a lot abroad, but the Finance Ministry panel found that much of that income is reinvested abroad instead of coming home and being converted into yen (Ministry of Finance). Japan also pays more and more for foreign digital services such as cloud computing and software. Those payments have kept its services balance in slight deficit overall, even as tourism brings money in (Bank of Japan; Ministry of Finance).
Is Japan getting less cheap?
Slowly, in some respects. Rengo, Japan’s main union federation, reported pay deals of 5.10% in 2024, 5.25% in 2025 and 5.01% in 2026. Those figures include regular seniority raises; the base-pay increases alone were 3.5-3.7%. The 2024 result was the first above 5% since 1991 (Rengo). After four straight annual declines from 2022 to 2025, real wages rose year on year in every month of 2026 from January through July (MHLW). The Bank of Japan has moved from below zero in early 2024 to 1.25% in September 2026 (Bank of Japan).
Japan has also started charging more at the door. On 1 July 2026 the departure tax, paid by everyone flying out, Japanese included, tripled from ¥1,000 to ¥3,000 (Japan Tourism Agency). Since 1 March 2026, Kyoto’s accommodation tax reaches ¥10,000 per person per night for rooms costing ¥100,000 or more (City of Kyoto). Himeji Castle now charges adults ¥2,500, except Himeji residents, who pay ¥1,000. The split is based on where you live, not nationality (City of Himeji).
The big picture has not changed. In July 2026, The Economist’s Big Mac index had the yen about 50% undervalued against the dollar, more than the 46% of a year earlier (The Economist). Japan did not get cheap because something broke overnight. It got cheap by standing still for three decades while prices and pay elsewhere kept climbing, and the bargain on a visitor’s receipt is the other side of a paycheck that did not grow.
Switzerland is the mirror image: why Switzerland is so expensive, yet still so rich.