

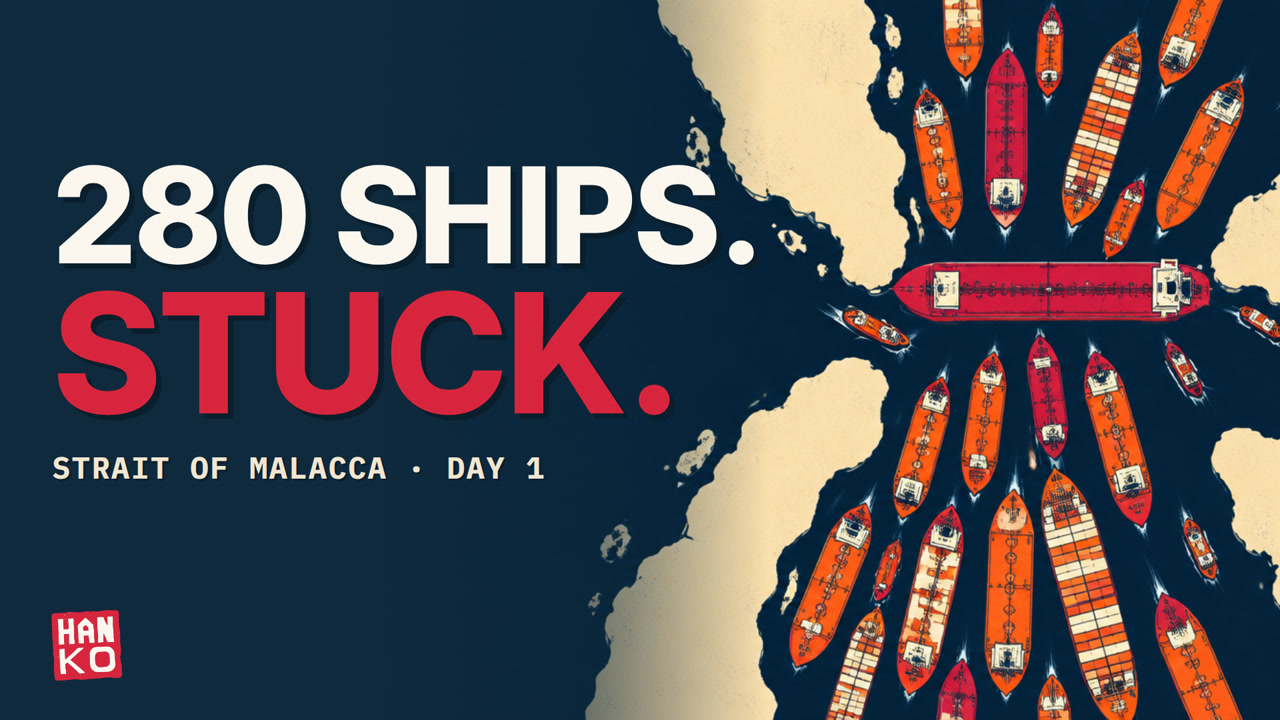
In our scenario, a collision shuts the deep-water lane of the Strait of Malacca for 30 days, and about 250 ships a day take the long way around through Indonesia, each adding roughly three extra days at sea (our math). Asia does not run out of oil: tankers arrive late, against stocks of around 200 days of net imports in Japan and South Korea (Statista/IEA). What runs short is ships, and over the month the detours add up to about 20,600 extra days of sailing, more than 50 years of ship time (our math).
A modelled what-if, built on real numbers
Nothing in this story happened. The accident, the tanker Kestrel Dawn, the radio calls and every character are fictional and dramatized. The baseline is a normal year, mostly 2025 data; every modelled number in the video is labelled SCENARIO ESTIMATE.
One premise is fixed: the deep-water lane stays shut for 30 days, so the biggest ships cannot pass. In real life smaller ships might squeeze past a wreck sooner; in Baltimore in 2024 a shallow temporary channel opened within a week (USACE).
Day 1: one accident closes the strait
The strait carries about 280 ship transits a day, 102,525 in 2025, making it the world’s busiest waterway (Seatrade Maritime). In the first half of 2025, around 23 million barrels of oil a day passed through, 29% of all oil shipped by sea, mostly bound for China, South Korea and Japan (EIA). At the Phillips Channel off Singapore it narrows to about 1.7 miles, or 2.7 km (EIA).
Just before dawn on Day 1, two large ships collide and one grounds across the deep-water lane. About a dozen more ships arrive at the closed channel every hour (our math).
In March 2021 the Ever Given blocked the Suez Canal for six days (Baird Maritime), holding up an estimated $9.6 billion of trade a day (Al Jazeera). Suez handles about 50 ships a day (Al Jazeera); Malacca handles more than five times that (Seatrade Maritime).
Days 2-3: the queue and the detour math
By sunrise on Day 2, more than 200 ships are at anchor at the two ends of the strait (our math). In 2017 the U.S. Energy Information Administration estimated that a closure would force nearly half of the world’s fleet to reroute (EIA).
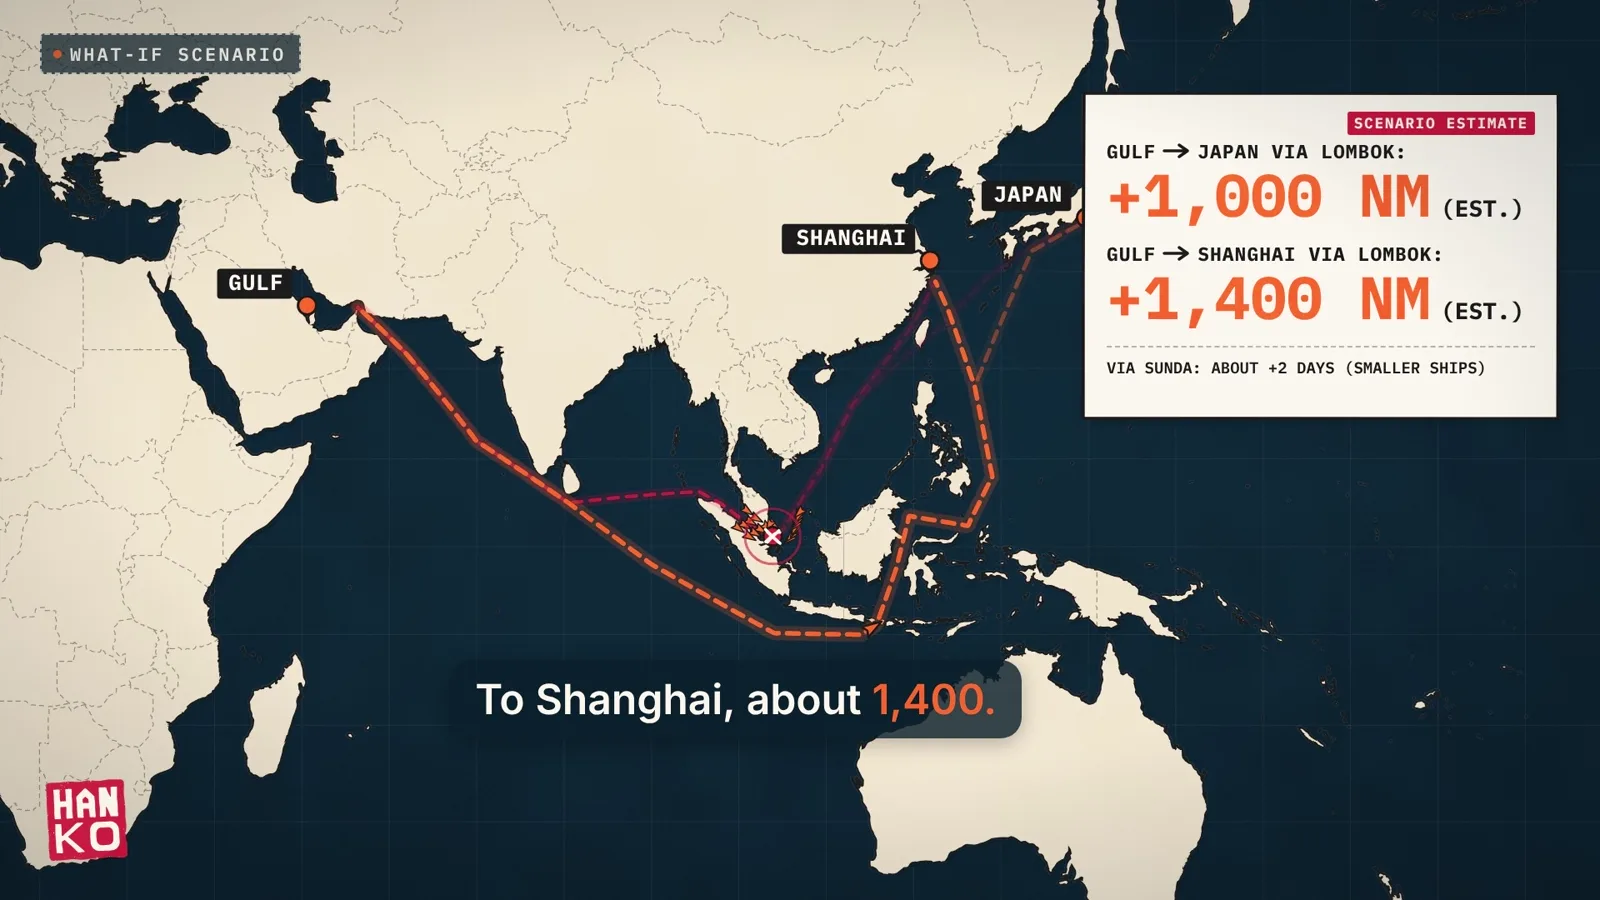
There are two doors through Indonesia. The Sunda Strait, between Sumatra and Java, is the shorter one, about two extra days by our calculation (our math), but it is shallow in places with strong currents, and ships over about 100,000 deadweight tonnes usually avoid it (ERIA). So the biggest tankers and container ships head for the Lombok Strait, more than 150 meters deep and 11.5 miles wide at its narrowest (ERIA), but much further east.
By our calculation, the Lombok route adds about 1,000 nautical miles from the Gulf to Japan and about 1,400 to Shanghai, three to five extra days each way (our math), in line with a published estimate of 1,000-1,500 nm (The Conversation). Ships already inside the strait must first sail back north, so they lose more.
Standard cover also excludes one cost. The widely used Institute Cargo Clauses (A) exclude loss “caused by delay”, even when an insured risk caused the delay (Institute Cargo Clauses). The cargo is covered; the calendar is not. By the night of Day 3 the queue peaks at around 400 ships, then shrinks as ships give up and go around (our math).
Days 3-4: Asia is not running out of oil
The oil is not missing. It is late. Every tanker still arrives, days behind schedule; by our calculation about 80 million barrels arrive late, once, within a range of 60 to 100 million (our math).
Going into 2026, Japan held about 200 days of net oil imports and South Korea about 208, by the IEA’s count, against an IEA minimum of 90 days (Statista/IEA). Stocks were drawn down in 2026: Japan’s figure on 25 September 2026 was 195 days on METI’s consumption basis (METI). China does not publish its stocks, but the EIA estimates its strategic inventories at nearly 1.4 billion barrels as of December 2025 (EIA), roughly four months of its 2024 crude imports (EIA; our math).
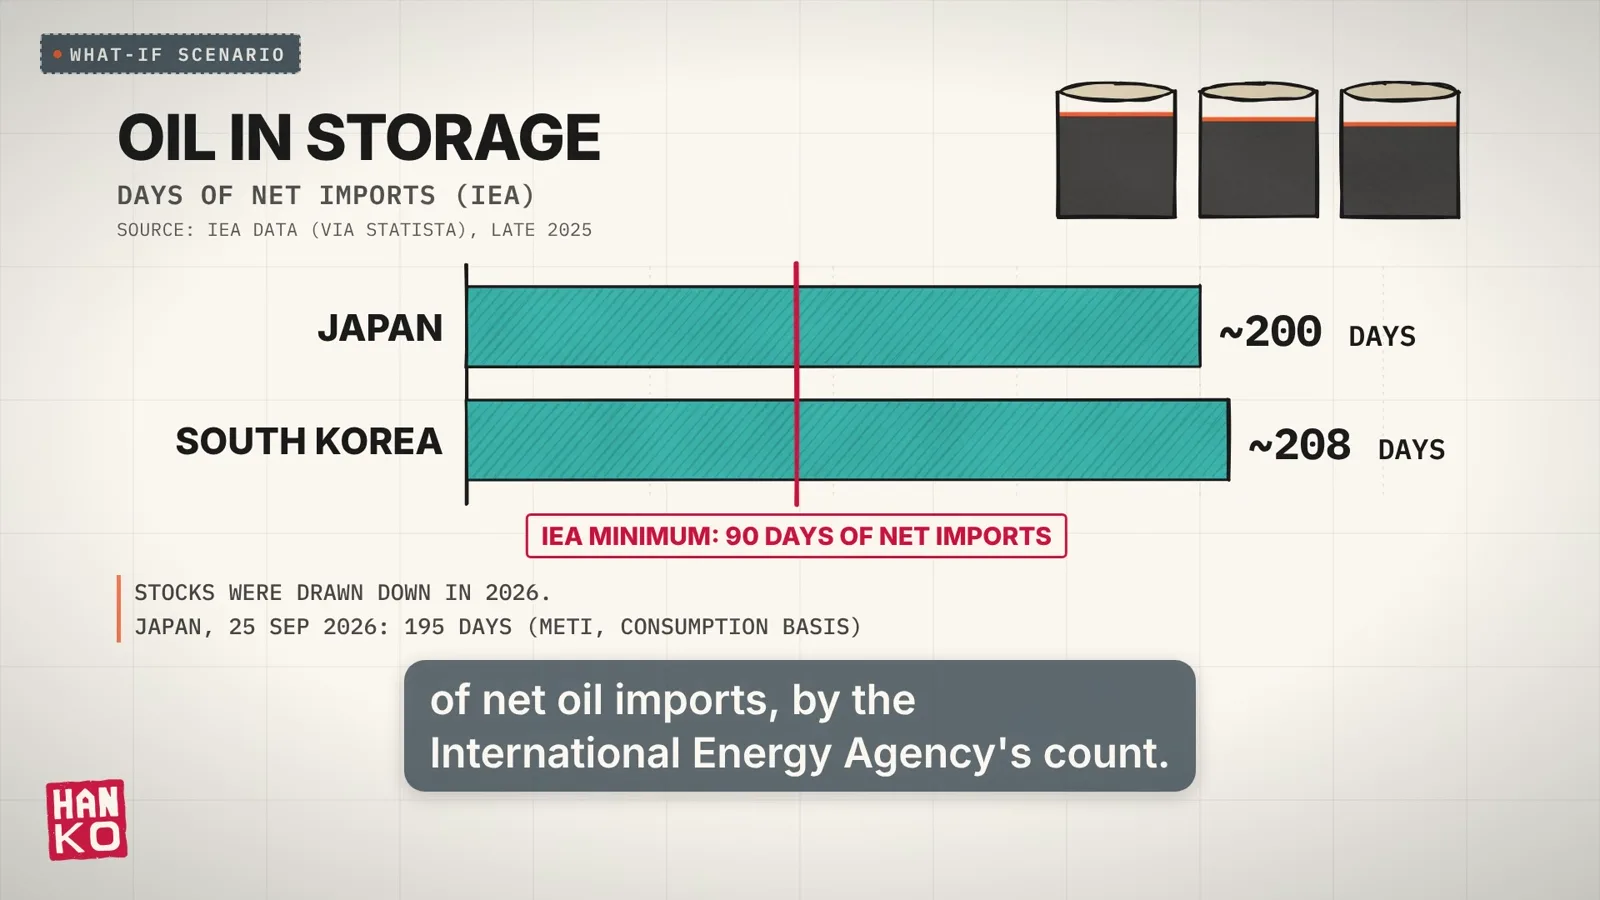
A few days of late oil is covered many times over. Refineries do not run dry; they pay more for everything that floats.
Days 5-7: gas, containers and your stuff
Gas is harder. Liquefied natural gas is chilled to about minus 162 °C (DOE) and cannot be stockpiled the way oil can. By our calculation, Japan’s major power companies held about two weeks of the country’s LNG imports on 1 March 2026 (METI; our math).
In the first half of 2025, about 9.2 billion cubic feet of LNG a day moved through the strait (EIA), but most of Japan’s gas never comes near it: in 2025, 39.7% came from Australia and 10.8% from the Middle East (METI). China has the most at stake: Qatar-to-China cargoes are 28% of the LNG passing through (EIA).
On Day 6 come the boxes. The strait carried 23.7% of world seaborne trade by volume in 2023 (UNCTAD), including the main container route between East Asia and Europe. Singapore sits at the blockage: in 2025 its port handled 44.66 million TEU and sold 56.77 million tonnes of ship fuel (MPA). The port stays open but stops being a crossroads.
By Day 7, sailings are cancelled and rerouted. The smallest, most valuable parts often fly: air carries over 35% of world trade by value and less than 1% by volume (IATA). Bulky goods sail, and about 26% of the world’s seaborne car trade passed the strait in 2023 (UNCTAD). After one week, a new phone probably shows up; a new car might not.
Week 2: the real shortage is ships
By our calculation, a tanker’s round trip from the Gulf to China takes about 45 days, and the detour adds around nine: the same oil needs roughly 20% more tanker time (our math). In November 2025, with East Asian buyers booking many ships, rates for very large crude carriers from the Gulf to Asia were up 139% on a year earlier (EIA). In early 2024, when container lines started sailing around Africa to avoid the Red Sea, the Shanghai Containerized Freight Index’s January average more than doubled from December 2023 (UNCTAD).
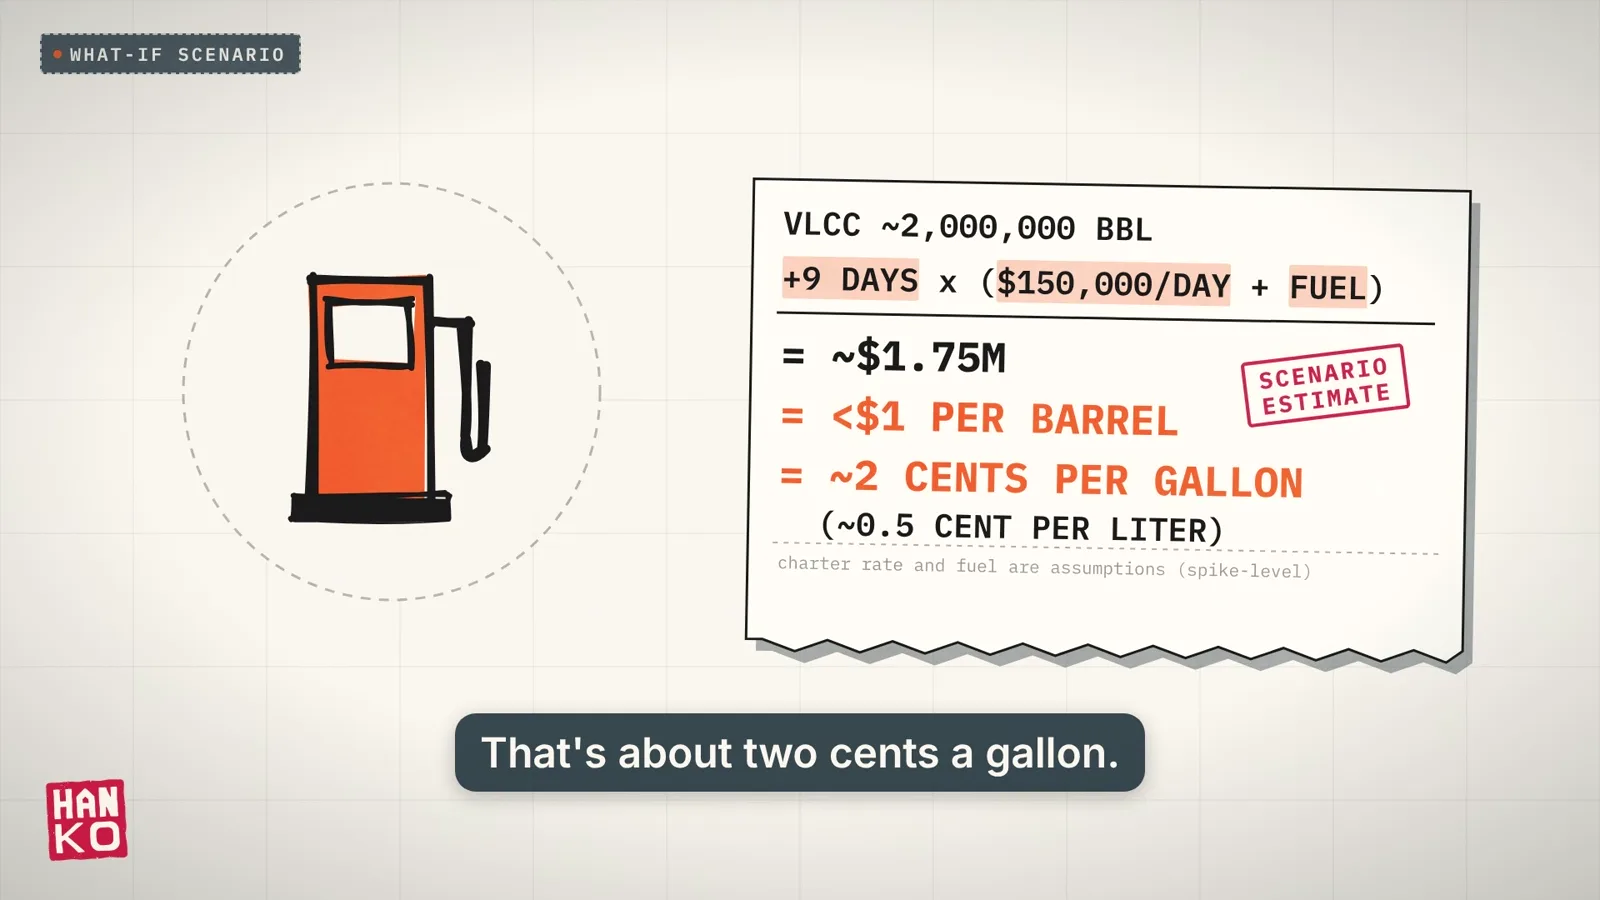
At the pump, the effect is small. A very large tanker carries about 2 million barrels (EIA). Even at an assumed spike-level charter rate of $150,000 a day plus fuel, nine extra days adds less than a dollar a barrel, about 2 cents a gallon (our math). Crude prices could still jump on fear alone; that part is psychology, not physics.
In stores, the effect is slower and smaller. UNCTAD forecast that the long Red Sea and Panama Canal disruptions would lift global consumer prices by about 0.6% by the end of 2025 (UNCTAD). Those lasted many months; one month at Malacca would likely leave a smaller mark. What shoppers would notice first is “out of stock” and “delivery delayed”.
The winners are ship owners, ports and fuel suppliers along the detour, and air freight. The Myanmar-China oil pipeline, with a design capacity of 22 million tonnes a year (Belt and Road Portal), could carry, by our calculation, less than 2% of Malacca’s normal oil flow (our math).
Weeks 3-4: the new normal, and why salvage is slow
By week 3 the detour becomes routine: schedules are rebuilt around Lombok, and refiners buy cargoes that do not need the strait. The cargo on the wrecked ship is another matter. Under general average, an old maritime rule, cargo owners can be asked to put up security toward the cost of saving the ship before their goods are released, as the Ever Given’s owner declared in 2021 (FIATA). Unlike delay, this is usually covered by cargo insurance (Institute Cargo Clauses).
The Ever Given took six days, but it was a grounding in a sandy canal bank, not a collision (Baird Maritime). Freeing the Ever Forward in Chesapeake Bay in 2022 took 35 days, 500 containers lifted off by crane barge and 206,280 cubic yards of dredging (Maryland MDE). After a container ship struck Baltimore’s Key Bridge in 2024, a temporary channel opened on day 7, a limited 35-foot channel on day 30, and the full channel on day 76, with about 50,000 tons of wreckage removed (USACE).
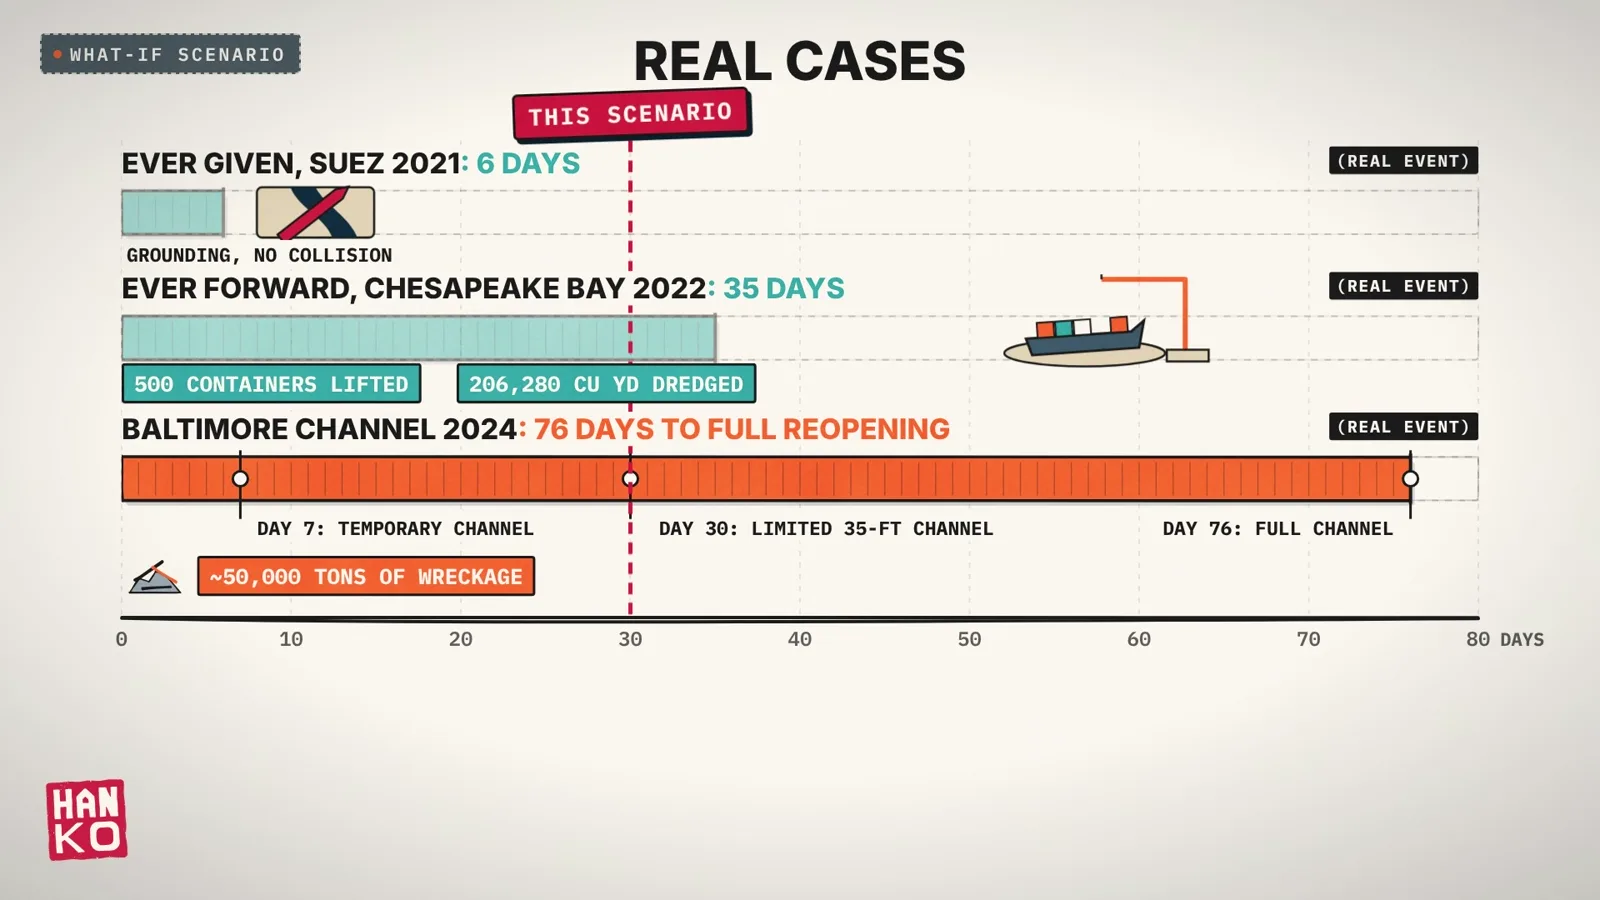
For a collision wreck in a busy lane, a month is not pessimistic. It might be optimistic.
Days 28-30: reopening, and 50 years of ship time
On Day 28 the wreck is refloated and towed clear; on Day 30 the lane reopens, one direction at a time at first. After the Ever Given, Suez cleared a backlog of 422 ships in five days (Al Jazeera). Here the queue is already down to about 50, because most ships went around (our math). The harder part is the ships still mid-detour and a month of container schedules to untangle.
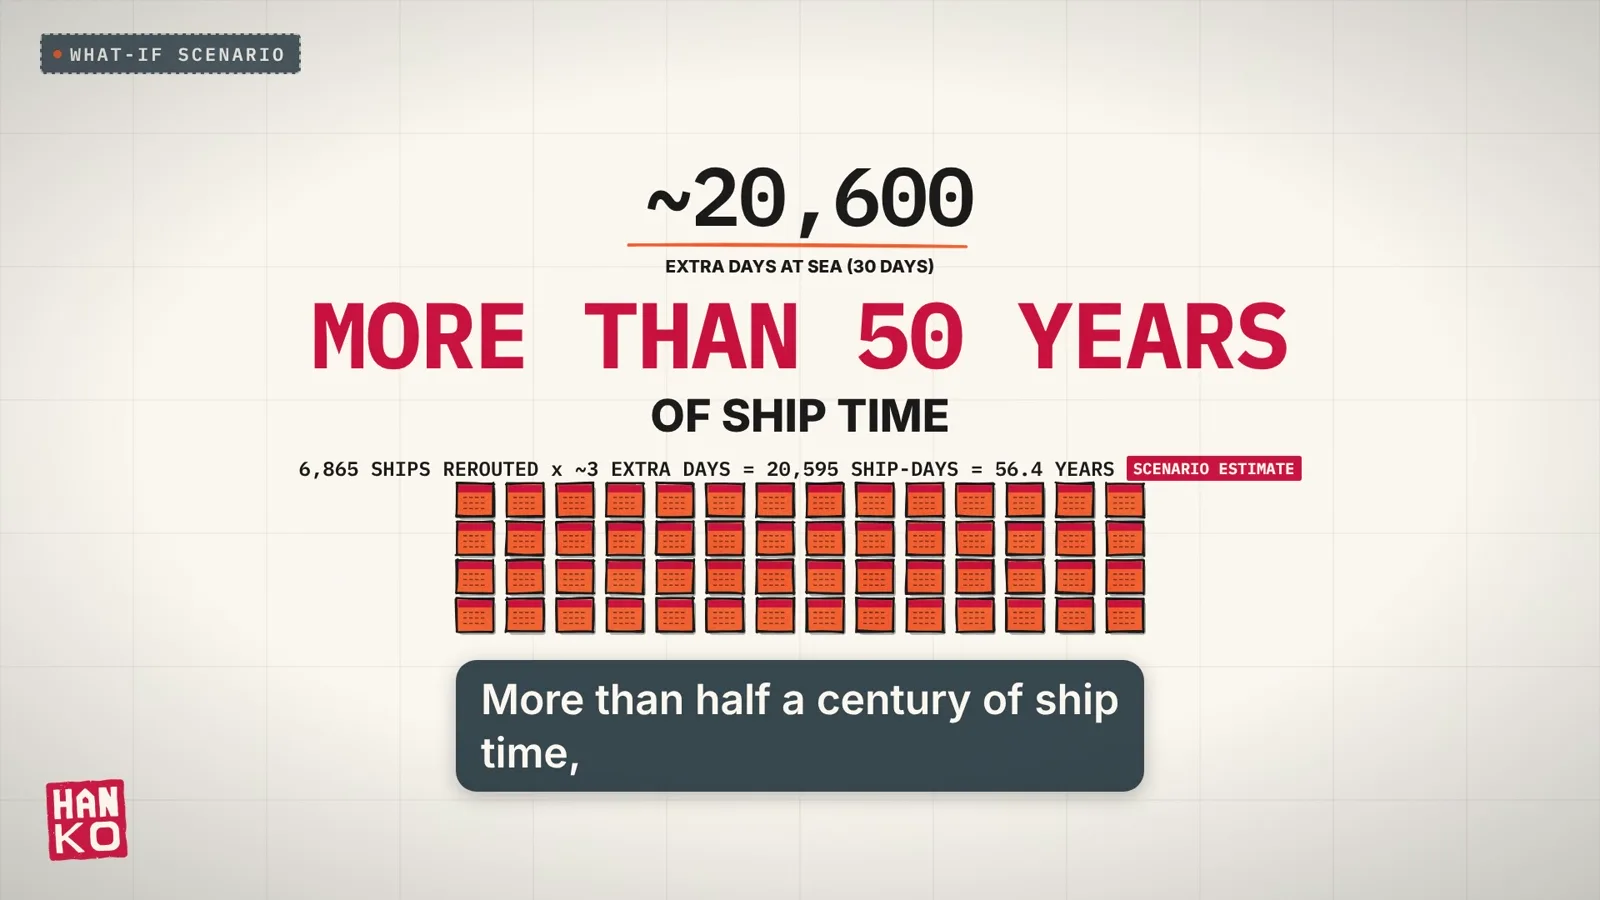
About 6,865 ships took the long way over the month, each spending about three extra days at sea: about 20,600 extra days of sailing, or 56.4 years (our math). Time spent at anchor is not counted.
The real world: why chokepoints matter
The accident never happened; the numbers underneath it are real. The idea of a canal across Thailand’s Kra Isthmus dates back to 1677, and it has never been built (Geopolitical Monitor). Its modern cousin, a land bridge of two ports linked by road and rail costed at about $29 billion (Pulitzer Center), was shelved in July 2026 after a government study found low economic viability and high risk (Xinhua).
The real defenses are quieter. IEA members must hold at least 90 days of net imports in emergency stocks (Statista/IEA). Since 2007, Indonesia, Malaysia and Singapore have worked with user states through the Cooperative Mechanism, and on 25 August 2026 they reaffirmed their commitment to keep the straits open and safe (MPA). Under two miles wide (EIA) and carrying nearly a quarter of the world’s sea trade (UNCTAD), the strait goes unnoticed until it closes.
For the other Day by Day scenario, see What if Japan stopped importing food.